Number Sense
Count, Compare, and Order
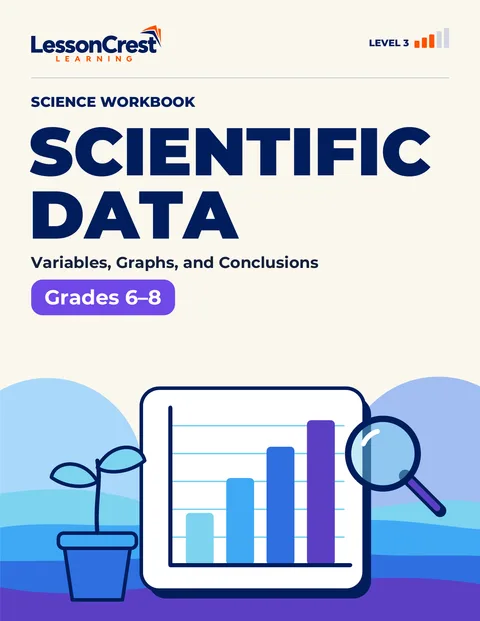
Read the shape, find the center, and say only what the data show.
This workbook helps learners in grades 6–8 turn small sets of data into clear, honest statements. They start with statistical questions, cases, variables and samples, then build bar charts, dot plots and histograms. Next they describe shape, clusters, gaps and unusual values, and calculate mean, median, mode, range, interquartile range and mean absolute deviation. The last module compares groups using center, spread and overlap, and separates what was measured from claims about cause. Every module follows the same seven steps, from a skills check to explained answers. All data sets are fictional. An explanatory answer key for adults is at the back.
For learners in grades 6–8 who can order numbers, work with decimals, read graphs and find a mean.
Covered
Covered: statistical questions, cases and variables, bar charts, dot plots, histograms, box plots, shape, outliers, populations and samples, relative frequency, mode, mean, median, range, interquartile range (IQR), mean absolute deviation (MAD) and careful comparisons.
Not covered
Not covered: standard deviation, scatter plots, probability and formal inference.
Before you start
Before you start: you should be able to order numbers, use fractions and decimals, read tables and graphs, and find a mean.
Things to have
- Tools: pencil, eraser and ruler.
- A calculator is fine for long sums unless your teacher says otherwise.
Notice
Pictures in this book are simplified learning models. Check answers with the explanations at the back of the book.
Check the skills you need before you begin. If something feels tricky, an adult can help you start in the right place.
Read a short, clear explanation of the new idea and the words that go with it.
Watch the idea being used, one step at a time, in a worked example.
Practice with prompts and help cues. The help gets smaller as you get stronger.
Practice on your own with different kinds of questions, and explain your thinking.
Look back at earlier learning so it stays strong, then check where to go next.
Check your answers. Each answer explains why, names a common mistake, and shows how to fix it.
Count, Compare, and Order
Equal Groups, Sharing, and Remainders
Parts, Sets, and Number Lines
Math workbook
Study design, sampling variation, intervals and tests